
How to use Breakpoints in Visual Studio 2019 – Breakpoint Guide – Csharp VB.Net
Breakpoints are one of the best features when debugging in Visual Studio! Let’s look at how to set and use breakpoints!
What are breakpoints?
A breakpoint indicates where Visual Studio should suspend your actively running code. This allows you to look at the value of variables, the behavior of memory, or whether or not a branch of code is being run. Stepping through your code is one of the best things you can do to learn how to program.
How to set a breakpoint
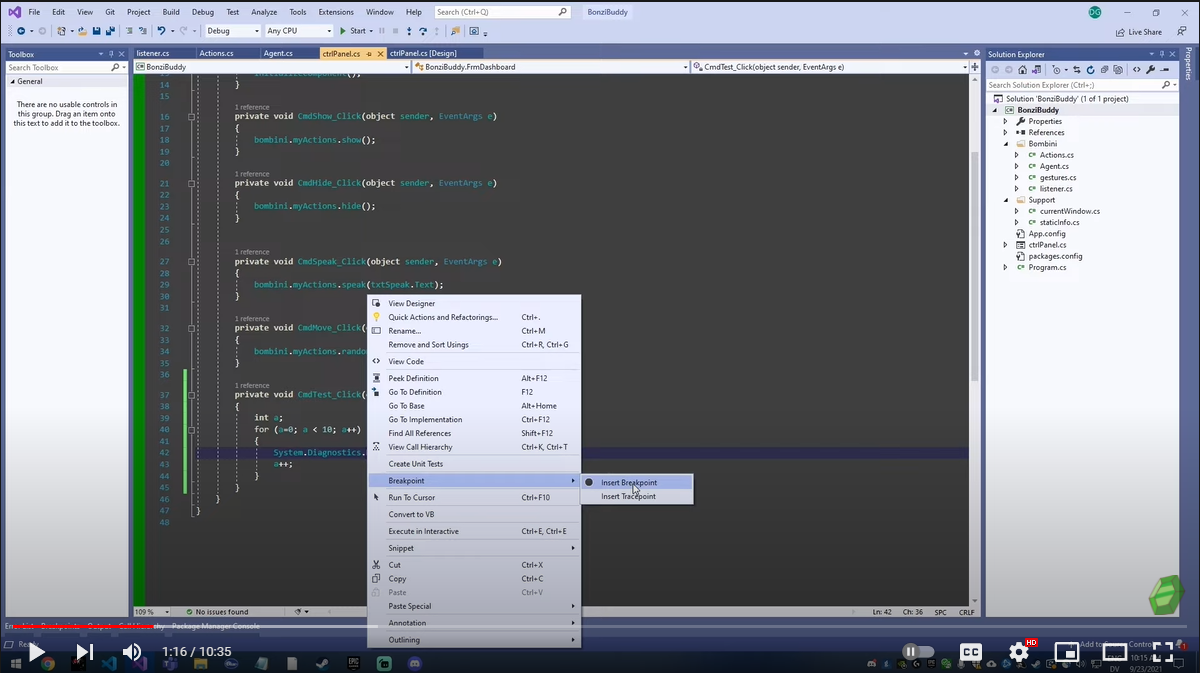
To start, you can set a breakpoint on any line of executable code by clicking in the margin of the code editor (The green line in the picture above) or simply by right-clicking on a line of code and selecting Breakpoint > Insert Breakpoint. Another option is to press F9 and a breakpoint will be inserted on whatever line you have selected.
Now we have a breakpoint, and we can work on our application!
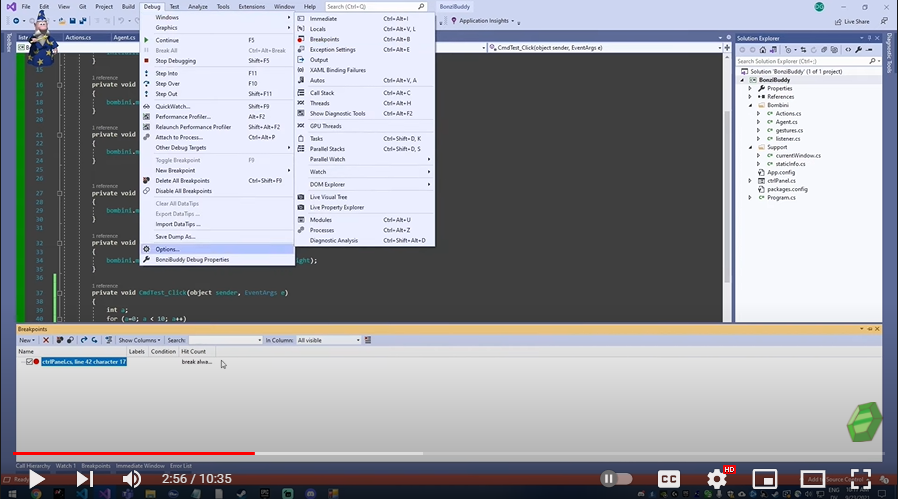
How to access the Breakpoint Pane
To access the breakpoint pane, hover over to Debug > Windows > Breakpoints. One thing you may want to do is to disable a breakpoint. You can enable/disable or delete breakpoints from this window, search and sort them. You can change breakpoint settings directly from this dialog. There is also an option to delete and export your breakpoints as well.
You need to start your app with the debugger attached to debugging the app process. F5 (Debug > Start Debugging) is the most common way. However, you may not have set any breakpoints to examine your app code, so we will first debug.
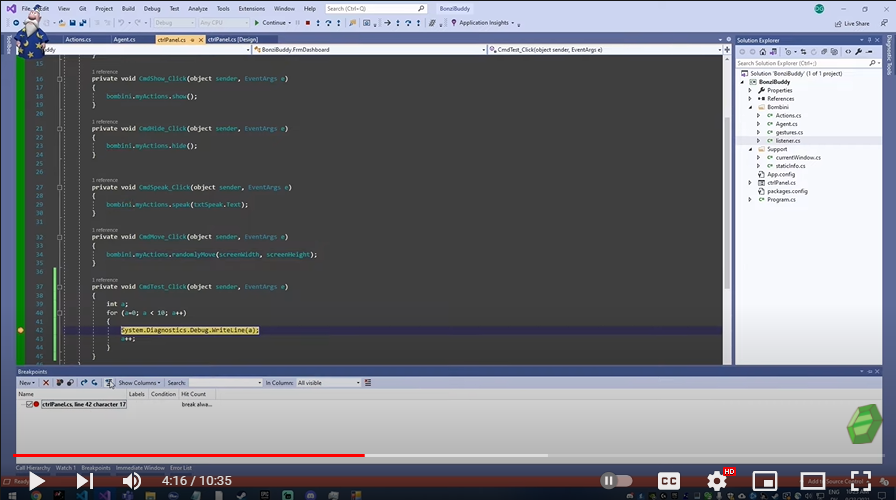
If you want to jump to the currently selected breakpoint, you could just click it, and it will jump into that right line.
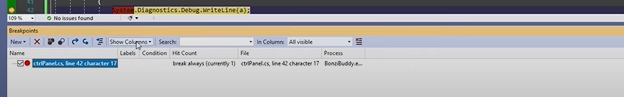
For more options, you could navigate through “Show Columns.” There is also a search box that is very handy to hover through your code!
You could also edit the label of a breakpoint. Within Visual Studio, once you’ve created a breakpoint, you can add one or more labels to it by simply right-clicking and choosing Edit Labels.
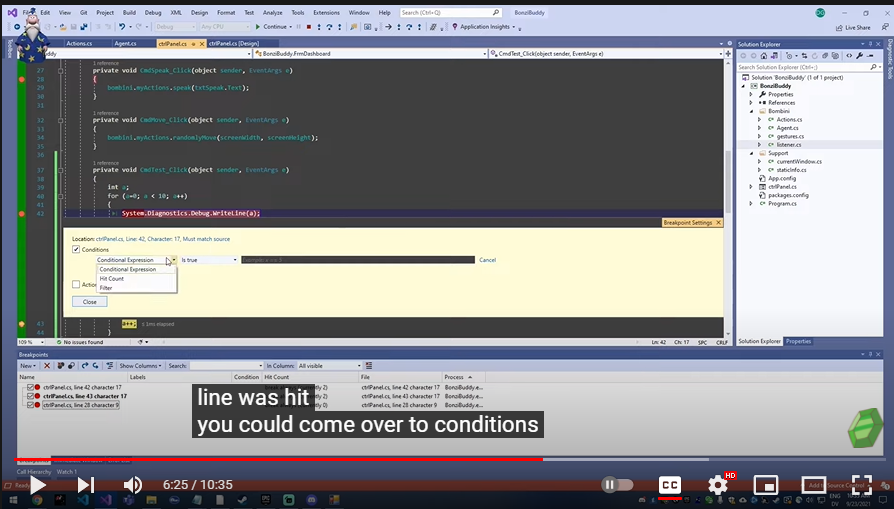
In terms of Hit Count, it works when you want a breakpoint to break after it has been hit a certain amount of times, you can choose Hit Count in the Breakpoint Settings and specify the number of iterations. You could also come over to Conditions (right-click on the breakpoint symbol (in the editor left margin or in the Breakpoint window) and select Condition… (or press Alt + F9, C), which will open the Breakpoint Settings window.) and you could set a hit count condition.
Lets get to know the Watch window
To navigate to the watch window, you will need to select Debug-> Windows -> Watch -> Watch 1. Once you have opened the watch window, you can use it in conjunction with breakpoints to easily check the value of variables while code executes.
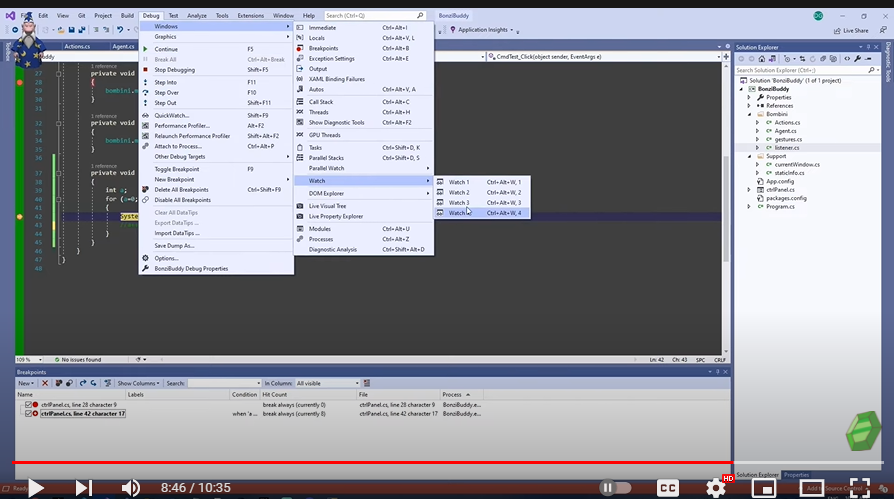
The Watch Window allows you to see the value of variables and expressions while debugging. It’s kind of like the DataTip you get when hovering over a variable, except that you can write any expression you want. It’s available from Debug | Windows | Watch | Watch 1 or Ctrl + Alt + W + 1.
There are four watch windows in Visual Studio, which you can use in different contexts (Watch 1, Watch 2, etc.).
Any expression can be entered into the watch window. The same rules apply to expressions as to code. So if you write an illegal expression, you’ll see the same compiler error.
To add items to watch, do any of the following: Write them manually in a new row of the Watch window—Right-click on a variable and choose “Add Watch” in the context menu. Right-click on a variable in the DataTip and select “Add Watch.” “Add Watch” button from QuickWatch.
Breakpoints are a great part of Visual Studio
One of the key features of Visual Studio Code is its great debugging support. VS Code’s built-in debugger helps accelerate your edit, compile, and debug loop. Breakpoints are an essential tool for debugging your applications. You set the breakpoints whenever you want to pause the execution.
Breakpoints really helped me learn how to program. I think they were one of the most valuable tools when it came to understanding code. If you just can’t wrap your head around how a certain block of code works… Just step through it using a breakpoint and watch it work it’s magic! I hope this quick guide on breakpoints helped you and I’ll see you in the next one!